Scripps Institution of Oceanography
Home
What we do
Research
Research Overview
Units and Terms
Data
Graphics Gallery
O
2
/N
2
Ratio & CO
2
Plots
O
2
/N
2
Ratio Plots
APO Plots
Maps
Publications
Scientific Literature
Technical Reports
FAQ
Personnel
Contact Us
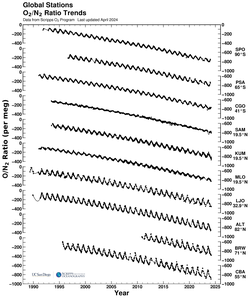
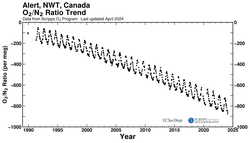
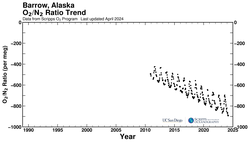
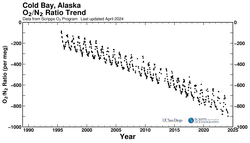
O
2
/N
2
Ratio Trends
All stations
Alert, NWT, Canada
Barrow, Alaska
Cold Bay, Alaska
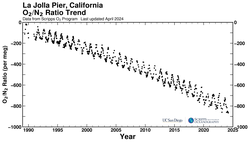
La Jolla Pier, California
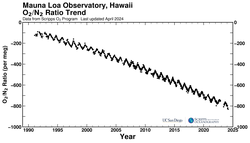
Mauna Loa Observatory, Hawaii
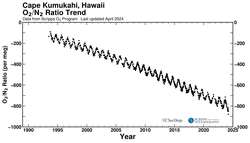
Cape Kumukahi, Hawaii
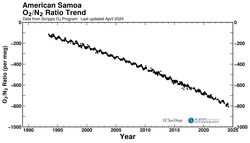
American Samoa
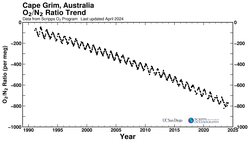
Cape Grim, Australia
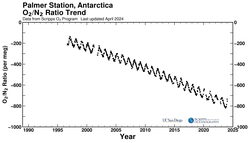
Palmer Station, Antarctica
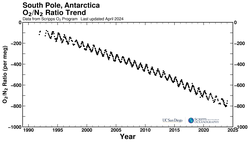
South Pole, Antarctica
Graphics Gallery
O
2
/N
2
Ratio & CO
2
Trends Plots
O
2
/N
2
Ratio Trends Plots
APO Plots
Maps